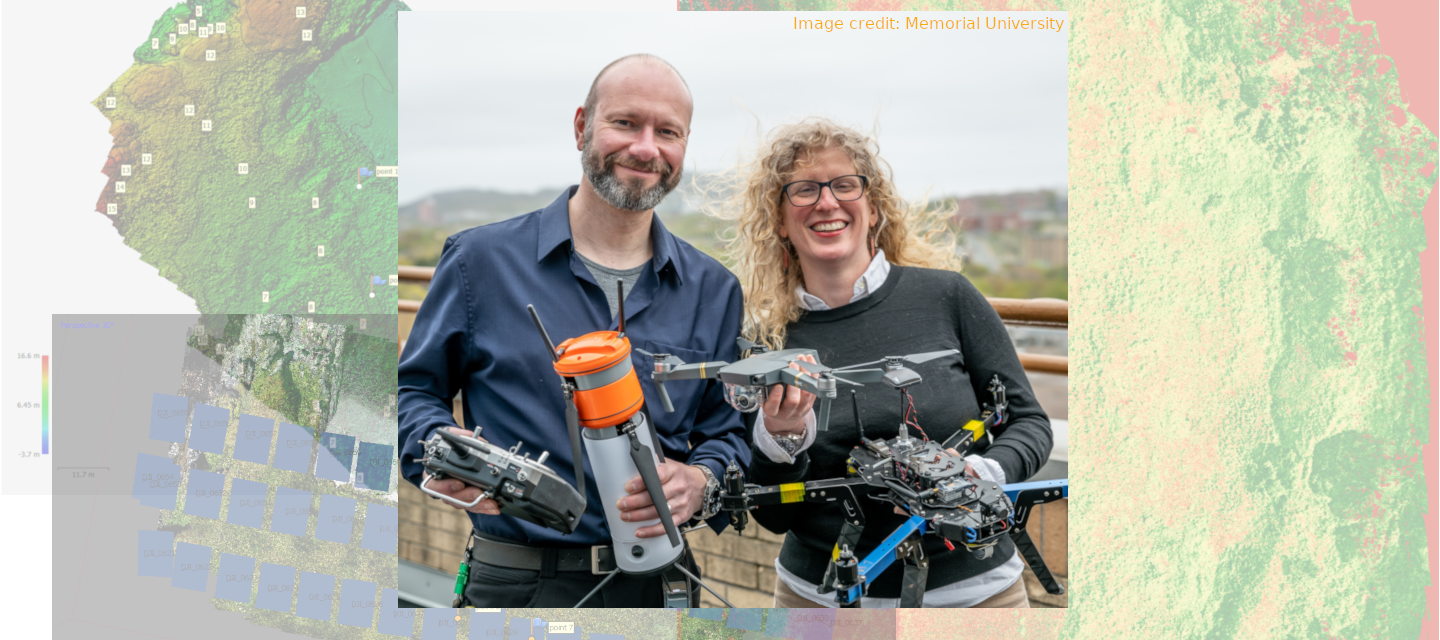
A 3DR X8 UAV taking off for a survey. This older and larger robot has been replaced by much smaller, more accurate and more maneuverable craft such as the DJI Mavic Pro. Image Copyright: A. Crompton & M. Bolli.
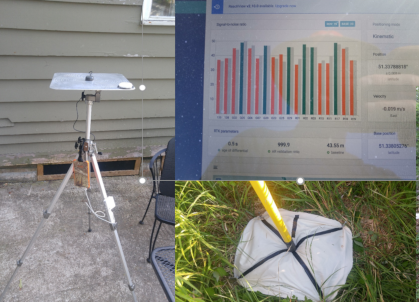
To achieve centimetre grade accuracy in survey models, conventional GPS is insufficient. We use survey grade GNSS equipment, often referred to as RTK (real time kinematic) to mark ground control points (GCPs). This is done using a base station and a roaming Global Navigation Satellite System (GNSS) unit. These extremely precise location measurements can be incorporated into the model mapping process. Because we add the points after the survey flight, this approach is technically called Post Processed Kinematic (PPK). Image Copyright: A. Crompton & M. Bolli, 2018.
An example of a dense cloud made up of around 40 million points. One can already recognize many features of the survey site. Image Copyright: A. Crompton & M. Bolli, 2018.
A full orthomosaic model of a survey site. Image Copyright: A. Crompton & M. Bolli, 2018.
It is essential to calibrate for lens effects when processing data. Un-calibrated data can easily lead to lens aberrations that introduce artifacts into the computation or results. This can lead to misinterpretations of survey data. Most professional photogrammetry software includes modules to calibrate and correct for lens and electronic shutter effects. Image Copyright: A. Crompton & M. Bolli, 2018.
A data centre with racks of high performance computing systems. Image courtesy The CREAIT Network, Memorial University. Image Copyright: A. Crompton & M. Bolli, 2017.
Spectral absorption curve for chlorophyll. Image credit: MapIR guides.
SEM-MLA elemental analysis on a targeted component in a SEM micrograph. Image Copyright: A. Crompton & M. Bolli, (2018). Analysis courtesy of CREAIT Network MLA laboratory.
No single method can adequately reveal the richness and multivariate contexts of historic landscapes. Each method we employ allows us to reconstruct a small part of the mosaic of a rapidly changing historic resource. Our project uses a constellation of procedures spanning the Sciences and Humanities. We use aerial remote sensing methods, archival research, material culture collections, digital humanities analysis, machine learning, geochemical and geophysical analysis. Our methods section below features an on-going description of our techniques. This methods section provides a top-level overview of our processes. We frequently update this section, so stay tuned for more information. If you are interested in a more detailed description of our processes, or you would like for us to give a talk on the subject and our experiences, or are interested in collaborating, please get in touch with us.
Aerial remote sensing
Modern unmanned aerial vehicles (UAVs) provide an ideal, cost effective platform for expedient characterization of potential archaeological sites. Equipped with an increasingly sophisticated and miniaturized array of available sensor platforms, these small, agile craft can quickly explore areas of interest and provide high resolution data in a variety of spectra and modalities. We pay special attention to aviation laws for any given region of survey investigation. In our current case, all legal and insurance requirements required by Transport Canada were followed prior to flying our survey.
Our current approach to aerial remote sensing of archaeological sites relies on multispectral and visible light sensors. When used in conjunction with low altitude, dense surveys, they generate many high resolution image tiles. These tiles are subsequently analysed using a series of our own processes which are tuned specifically to the types of landscape signatures we are hunting for. Once turned into point clouds using photogrammetry algorithms, we can generate orthographically precise terrain models. These are accurate to within 2-3 square centimetres when combined with ground control points (GCP) location data using Real Time Kinematic (RTK) or Post Processed Kinematic (PPK) based Global Navigation Satellite System (GNSS) systems. These models can also be imported into GIS systems and overlaid onto additional cartographic resources.
Computing orthographically accurate terrain models
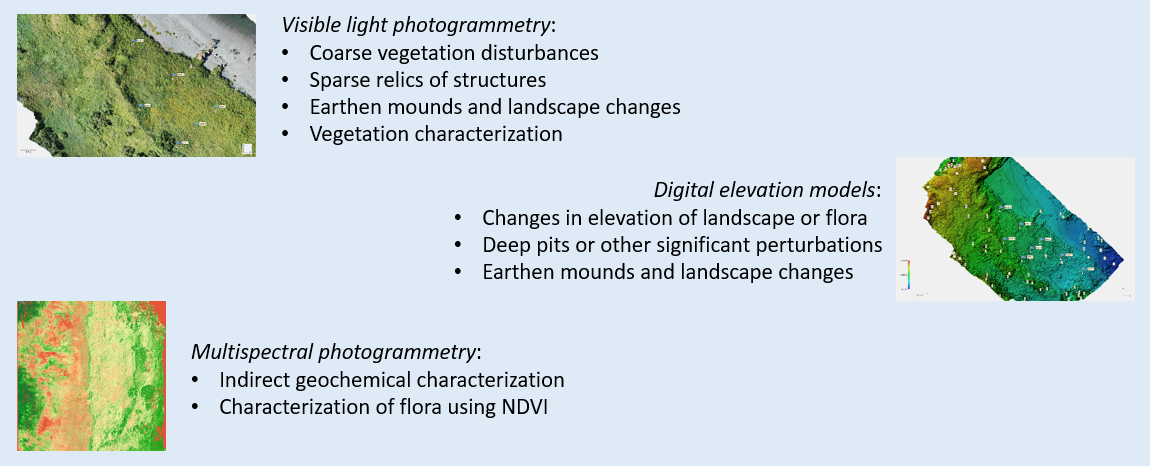
Once a complete set of survey data with accurate location information has been acquired, the image tiles are initially rendered into a sparse point cloud. This is best achieved using photogrammetry software, such as Agisoft Metashape or Pix4D, which uses “structure from motion” algorithms to align the image tiles and identify common tie-points in the image tile overlap. These tie points allow us to render a sparse cloud, a representation of the complete surveyed terrain. Together with the available location data from the UAV autopilot and GPS as well as the GCP data, the software can very accurately estimate the actual camera positions (the spatial orientation where each image tile was taken with reference to the survey site). From this, we are able to generate a “dense point cloud” which also allows us to measure depth profiles of terrain (or vegetation cover). These depth analyses are referred to as “Digital Elevation Models” or DEMs. The DEM provides false colour coding which represents elevation changes. We can now analyse minute changes in vegetation cover elevation changes (or in the case of bare ground, terrain elevation). Correlation of such elevation differences with location data of suspected features, allows us to generate a detailed site relief.
From the dense cloud, we are also able to generate an accurate model of the whole survey site which is orthographically correct. An accurate orthomosaic can be imported into additional Geographic Information Systems (GIS) which allow us to overlay our survey data with existing cartographic information. An accurate orthomosaic is extremely useful since we can accurately measure feature distances to approximately 2 square centimetres for further analysis.
Adequate controls provide confidence in the data and results
At first glance, this process appears very straightforward. There are however multitudes of factors which can create conditions that make it difficult to not only acquire the data but to process it. We must pay special attention to our assumptions about the data and process. Acquisition using UAVs is a very rapid means to gather data but any errors in the survey tiles, such as insufficient overlap and side-lap of tiles, angular error with respect to the survey surface, GNSS errors and inaccuracies, image blur, sensor lens inconsistency and imperfections, inadvertent shadows from oblique lighting and similar, can have deleterious effects. In the worst case the processed data can be meaningless. We must therefore always build controls into the process of acquiring data. Some of these controls include acquiring multiple survey data collections with independent but equivalent sensors on multiple UAVs. Once processed, the results of these independent surveys should be equivalent. The ambient light at different time of day can significantly alter survey outcomes. It is important to keep this in mind when interpreting results. Using a calibration target at time of survey acquisition, especially in the case of multispectral data, is essential. Ambient light contains many spectra and varies throughout the day and changes with cloud cover. To make any assertions using spectral ranges from the survey data, we must be able to calibrate our data to a known standard or risk having data sets that cannot be compared.
Computational limits and the value of grid/HPC computing
Our surveys are acquired at particularly low altitude (20 to 35m above ground) to provide for exceptionally high resolution. These low elevation flights of UAVs generate very large numbers of source image tiles. This is also proportional to the surface area of investigation and the amount of tile overlap and side-lap. In our current surveys, we typically set overlap and side-lap to at least 75%. These settings frequently produce in excess of 300 source image tiles, and in some cases 800 or more. Beyond approximately 600 survey image tiles, computational processing can become problematic. Even powerful single workstation systems are no longer able to compute dense point clouds and orthomosaics in a useful time frame, even with the inclusion of multiple graphics processors (GPUs). A single compute session may take upward of 10 or more hours, but in the case of very large data sets this scales poorly with models requiring in excess of 24 hours of compute time.
Finding a way to scale the computational power required by these data sets becomes increasingly important. It is here where we turn to grid computing or high performance computing (HPC). This allows us to use the power of computational clusters with hundreds or thousands of CPU and GPU cores which solve some of these problems in parallel. This provides dramatic improvements to problem solvability and scales reasonably well with data set size and complexity. We would like to acknowledge our research partners Atlantic Canada’s “ACENET” and Canada’s national advanced research computing consortium “Compute Canada/Calcul Canada” for their computational support in our project.
Multispectral analysis and vegetation reflectance as an indicator of vegetation state and soil variability
Under the correct conditions, multispectral imaging (imaging in multiple discrete spectral bands including near-infrared - NIR) is designed to visualize the variable photosynthetic activity of vegetation. Today this is typically used in the agricultural sector, where it provides a cost-effective means to assess the relative plant health of large crop fields. Plant leaves which are healthier fluoresce brighter under certain spectral bands and near-infrared. This can be analysed and quantified against standards, generating comparable indices of photosynthetic activity and therefore vegetation productivity, generally referred to as the “Normalized Difference Vegetation Index” (NDVI). It uses the NIR and red channels in its formula. Healthy vegetation (chlorophyll) reflects more near-infrared (NIR) and green light compared to other wavelengths, but it absorbs more red and blue light. The formula on the right describes the mathematical relationship.
In part the NDVI value (related to photosynthetic activity) can be related to underlying soil conditions. The more fertile soils generate healthier plants and therefore show greater photosynthetic activity, which can be assessed using this technique. The ability under the appropriate set of assumptions, to infer geochemical soil quality based on NDVI values provides a potential classification method when aerially prospecting for French historic fishery archaeological sites. As fish were processed and their offal discarded on the ground, the underlying soil layers became enriched. Vegetation which subsequently colonized overtop of these enriched soils, grew more vibrantly than compared to locations which did not undergo this anthropogenic transformation. Using this technique, we can see differential NDVI activity roughly where previous historic occupation occurred.
Each survey method and modality has a story to tell: a composite approach to site detection is key
Geophysics and Geochemical analysis tools
We are also interested in correlating the anthropogenic soil signatures derived from aerial NDVI indices with soil geochemistry in those locations. We typically investigate for enriched Phosphorous levels among other minerals, such as Nitrogen and Calcium, which are indicative of anthropogenic activity over many years. This is typically accomplished using Inductively Coupled Plasma Mass Spectrometry. We are also interested in the amount of bio-available mineralization. Some preliminary work has been done using Scanning Electron Microscopy and Mineral Liberation Analysis (SEM-MLA). Using this method we can visualize differential mineral composition for specific features in a micrograph.
An example of UAV survey tile exposure position overlaid onto a dense point cloud photogrammetric representation of a archaeological site. Ideally you want even spacing between tile exposures that are NADIR to the survey surface and evenly spaced aerial transects. Image Copyright: A. Crompton & M. Bolli, 2018.
A representation of a sparse point cloud of an archaeological site with ground control points (GCPs). Image Copyright: A. Crompton & M. Bolli, 2018.
Example of a Digital Elevation Model (DEM) derived from location data and the dense point cloud. Image Copyright: A. Crompton & M. Bolli, 2018.
Always build in checks for survey tile acquisition overlap. Insufficient overlap and side-lap, can introduce “holes” in your data set. At best these show up as areas with no data in the results, at worst they can generate image artifacts that may lead to erroneous site interpretation. Image Copyright: A. Crompton & M. Bolli, 2018.
An example of a reflectance calibration target from MapIR. Designed for a speciific sensor, these targets allow calibration at time of survey flight so that we measure our reflectance values against standards. This allows us to calibrate each pixel to a known reflectance value. Source: Mapir.
An example of a false colour coded NDVI index image. This orthomosaic, derived from a multispectral series of UAV acquired image tiles, shows healthier photosynthetic activity in green and poorer in red. The greenest index also corresponds roughly to historic fishing sites. of this area. Image Copyright: A. Crompton & M. Bolli, 2019.
SEM-MLA elemental analysis on a targeted component in a SEM micrograph filtered for surface (bio-available) Phosphorous only. Copyright: A. Crompton & M. Bolli, (2018). Analysis courtesy of CREAIT Network MLA laboratory.


